


The measurement and recording of alcohol-related violence and disorder
A report of research commissioned by the Portman Group
Questionnaire and telephone surveys
On the basis of extensive meetings and interviews with key stakeholders three questionnaires were designed for administration to police licensing officers, town centre managers and coordinators of crime reduction partnerships (CRPs). In addition, a telephone survey protocol was developed for lead consultants in accident and emergency (A&E) departments of NHS Trust hospitals. Copies of these procedures are contained in Annex A.
The data derived from these procedures are summarised below.
Police data
Questionnaires were sent to 89 police licensing officers - covering all of the main police districts, of which 61 were returned - a relatively high (69%) response rate.
Recording of alcohol-related crime
Of those licensing officers returning questionnaires, 71.4% reported that they kept records of offences which were deemed to be alcohol-related. Over a quarter of all police forces, therefore, keep no records at all in this context.
The form of data recording for offenders who had been charged is summarised in Figure 3.1 below.
Figure 3.1 Method of recording for those charged with alcohol-related offences
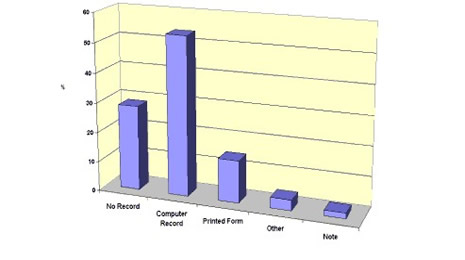
From Figure 3.1 we can see that a small majority (57%) of police forces use some form of computer database for the purpose of recording alcohol-related arrests. We should note, however, that the types of database vary widely and many are incompatible with those used in other regions (see section 3.1.3).
Of the 29% of forces which did not keep any records of alcohol-related crime, 69% said that they had no intention of doing so in the future. Where recorded systems were planned, all indicated that these would take the form of a computerised system.
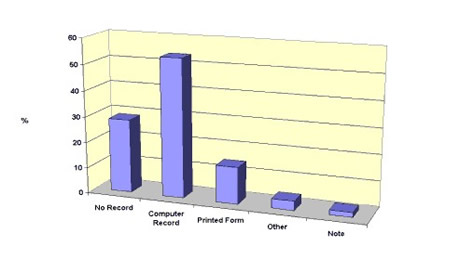
The recording of reports of alcohol-related offences, as opposed to actual arrests, is summarised in Figure 3.2. Here we can see a broadly similar pattern to that shown in Figure 3.1, but with fewer licensing officers recording data of this type. The frequency of computer databases was also slightly lower in this context (53.6%). Reservations about the reliability of these measures must be expressed since determining whether alcohol was a factor in a reported crime where the offender is not apprehended is always very difficult.
Figure 3.2 Method of recording for reported alcohol-related crimes and disturbance
Definitions of ‘alcohol-related’
Police licensing officers varied in their definition of the label ‘alcohol-related as shown in Figure 3.3.
Figure 3.3 Definitions of 'alcohol-related'
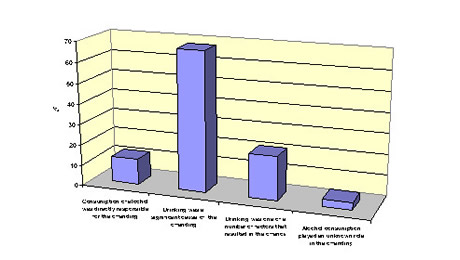
While a majority (68%) felt that the term meant that drinking was a significant cause of the offending, others felt that it was just one of a number of factors. Only 12% felt that the term referred to alcohol as being directly responsible for the offences. These varying definitions add to difficulties in interpreting police data, as discussed in Section 4.1.
Figure 3.4 Perceived reliability of records
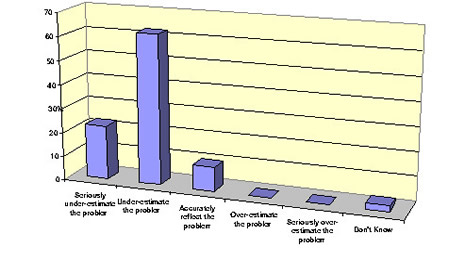
Perceived reliability of records
The majority of police licensing officers felt that their records underestimated the true level of alcohol-related crime and disorder, as shown in Figure 3.4. Only 10% felt that their data were an accurate reflection of the real problem. None, however, felt that their data over-estimated the seriousness of the problem.
These responses are very much in line with the qualitative material derived from meetings with licensing officers. The majority felt that many alcohol-related incidents went unreported and unrecorded. Very few, however, were able to say what the margin of this under-recording might be.
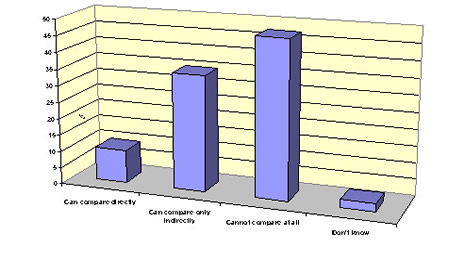
Comparability of records
Police licensing officers were asked about the extent to which they were able to compare their own figures with those collated by other police forces.
We can see from Figure 3.5 that in only a small minority of cases (10%) was there any direct comparability between the sets of data. In 35% of cases a degree of indirect comparison was possible, but in 45% of cases no comparisons were possible at all.
These findings illustrate very clearly the wide variation in recording and collating practices which currently exist among police forces. The practices differ not only in terms of the format of forms and computer databases which are used but also in the definitions of ‘alcohol-related´, the types of crime that are included, whether they are based on crime reports or charge sheets and a number of other factors. As we discuss in Section 4, a more definitive and reliable guide to the nature and pattern of alcohol-related violence and disorder at national and regional levels will require substantially greater comparability of data from individual police forces and, indeed, from basic command units within police forces.
Reporting of alcohol-related crime data
We noted above that over one quarter of police licensing offices collect no data at all on levels of alcohol-related crime and disorder. Of those who do collate such information, only 30% present this information in accessible reports. This is consistent with the findings from our interviews and discussions with police officers. Unless there is a specific reason to present such data - e.g. when opposing the grant of a liquor licence or when seeking the revocation of a licence - the information is often not used for any strategic purpose.
Figure 3.5 Comparability of data
Percentage of crimes deemed to be alcohol-related
Due to the inconsistencies and potential sources of unreliability noted above and to the fact that relatively few police forces collate their data in the form of reports, only 10% of licensing officers were able to provide an estimate of the extent to which crime and disorder is related in one way or another to the consumption of alcohol. Such estimates varied between 30% and 85%.
This finding is quite surprising given the frequency with which statements concerning alcohol´s role in crime causation are made by police officers. It is clear that bold assertions, such as those which suggest that up to 80% of all violent crimes and disturbances are alcohol-related, are based on scant and often unreliable evidence.
Recording of offences in and around licensed premises
While many police forces did not keep records of crimes deemed to be alcohol-related, the majority (82%) did maintain records of crimes and disturbances committed in and around licensed premises in their areas. This enabled them to identify ‘trouble spots’ and take appropriate action. This finding is consistent with the interview and discussion material with licensing officers. Most see their role as being focused on licensing-related matters rather than on alcohol-related crime in general.
Partnership schemes
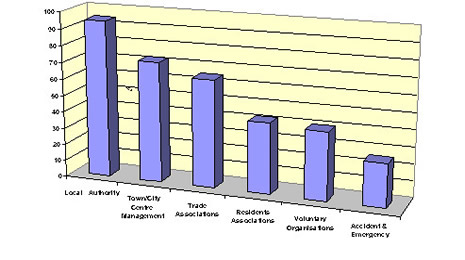
The large majority of police forces (96%) were involved in one way or another with partnership schemes aimed at the reduction of alcohol-related problems. As we can see from Figure 3.6, these most typically involved liaison with local authorities, town centre management and trade organisations. A significant number, however, were also involved with residents’ and voluntary organisations and with hospital A&E departments. A further 11% of police licensing officers were directly involved in Pubwatch schemes.
Figure 3.6 Involvement in partnership schemes
Town centre visitors and drinking
Estimates of the number of additional visitors to town and city centres on Friday and Saturday evenings varied widely, reflecting the size of towns and cities themselves and the extent of the night-time economy. The highest was an additional 80,000 people and the lowest a mere 150. The average figure was 11,700.
Whatever the accuracy of these estimates it is clear that night-time economies attract very significant numbers of people at weekends, particularly those in the 18-26 year old categories. This has to be borne in mind when interpreting crime and disorder statistics and particularly those where alcohol-related crimes are recorded. Of the 11,700 additional people it is very likely that the large majority will have consumed alcohol on their visits. Police licensing officers in the survey themselves typically estimated that 70% of these visitors would have BACs in excess of the limit for driving by 11.30 pm. Any offences committed by this population would, therefore, most likely be recorded as ‘alcohol-related’. The distortions which can arise from such data are discussed in Section 4.5.
Police awareness of data limitations
It was clear from both the questionnaire survey and from the extensive interview and discussion material that many police officers and licensing officers in particular were well aware of the limitations of their own data. Almost all recognised that there was a need for improved recording and collation practices and for more systematic definition of alcohol-related crime and disturbance. The suggestions made by the questionnaire respondents included the following:
- National norms to guide the recording of alcohol-related offences.
- New or improved computer systems.
- Better assessment and recording of arrested persons.
- Specific teams of analysts.
- Home Office requirements to collect data.
- National standardisation of data collation.
- Recognition of the difficulty of quantifying alcohol as a causal factor.
Concerning the last point above, many officers emphasised that, even with the most sophisticated of recording and collating systems, the causal role of alcohol could never be established with any certainty.
Hospital accident and emergency data
Telephone interviews were conducted with 70 A&E consultants in NHS Trust hospitals in various regions of England, Wales and Scotland.
Recording of patients’ alcohol consumption
In the majority of A&E departments (60%) alcohol consumption was recorded routinely, while in 38% of cases such consumption was noted in special cases. In fewer than 2% of departments there was no recording of whether patients had been drinking.
In those departments where consumption was recorded only ‘sometimes´, the reasons given for the recording are shown in Figure 3.7.
Figure 3.7 Recording of patients' alcohol consumption
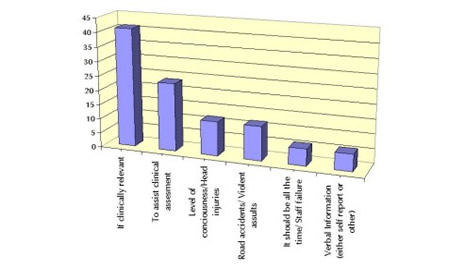
In many cases assessments of alcohol consumption were made only if it was seen as clinically relevant or was necessary for clinical assessment or if road accidents or violent assaults were involved. Others undertook such assessments where there were grounds for referral to alcohol counselling services or in cases where ‘erratic’ patient behaviour was observed. In some instances, however, consultants felt that the fact that assessments and recordings were only conducted ‘sometimes’ was due to pressures on staff and should, in fact, be undertaken routinely.
Methods of testing
In the majority of cases (78%) the assessment of alcohol consumption was based on visual determination but over half (54%) of the departments also used breath testing in some or all cases. Both doctors and triage nurses were equally involved in the assessments.
Need for improvement
The large majority of A&E consultants (80%) felt that procedures for assessing alcohol consumption needed to be improved. In particular they felt that more systematic methods were required for recording and collating data in this area, including improved computer systems. Twenty percent of consultants also felt that breath testing or some other objective means of quantifying BACs was required. Others felt that there should be more concern for long-term alcohol dependency problems as well as acute intoxication and identified the need for diagnostic tools such as CAGE1 and other procedures.
Identifying the location of drinking
Consultants were asked if they would be prepared to ask patients who presented with ‘alcohol-related’ symptoms where they had consumed their alcohol. A majority (79%) said that they would be prepared to do so and 15% said that they already did. Many felt that it would help in joint initiatives with the police and the licensed trade to identify trouble spots and to tackle more effectively alcohol-related violence and disorder.
Estimates of ‘alcohol-related’ violent injuries
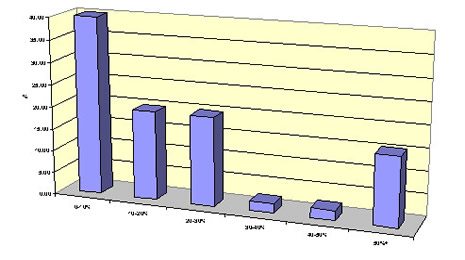
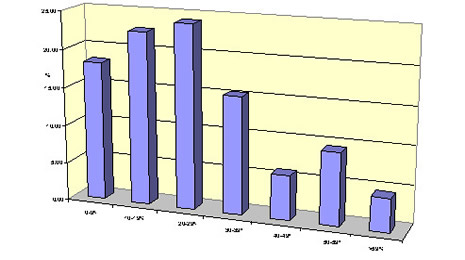
A&E consultants varied quite widely in their estimates of the proportion of violent injuries which were assessed as being ‘alcohol-related’, as shown in Figure 3.8.
Figure 3.8 Estimates of 'alcohol-related' violent injuries
From Figure 3.8 we can see that the most typical estimate was that 70-80% of all violent injuries were alcohol-related. We should note, however, that very few consultants had objective data to support their estimates which, in most cases, were based on ‘experience’. In Section 2.2.11 we noted that, where objective data are available, the proportion of injuries that are classed as alcohol-related tends to be substantially lower.
Increased patient level at weekends
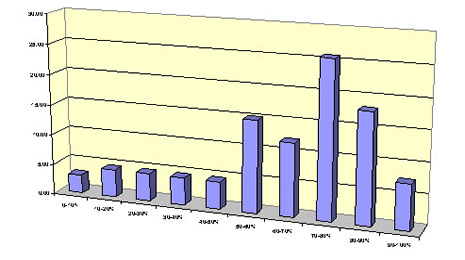
A&E departments typically receive between 100 and 200 patients per day. The majority of consultants (78%) reported that patient numbers increased substantially on Friday and Saturday nights by percentages summarised in Figure 3.9. Here we can see that the most typical increase was by up to 10%, with 40% of consultants reporting this figure, although in a few cases the increase was over 50%.
Such increases are often seen as confirming the extent to which alcohol is implicated in violent, physical injuries. Some caution, however, must again be employed in interpreting these figures. The night-time economies which operate on Friday and Saturday evenings result in substantial additions to the local populations. The more people there are in the area the greater the likelihood of higher numbers of injuries, of whatever nature. This need to control for population sizes, which applies to the interpretation of both police and A&E data, is discussed in Section 4.5.
Figure 3.9 Increased patient level at weekends
Information supplied to the police
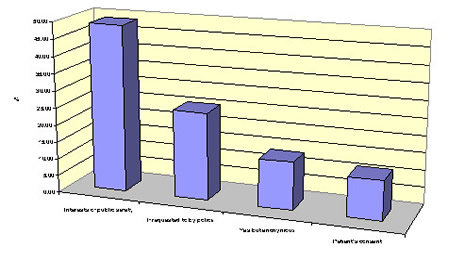
There were some clear divisions concerning whether information about violent injuries should be passed to the local police. Over one quarter of consultants (28%) said that they did not pass any patient details or records to the police, while the same proportion said that they did so on a regular basis. Of the 44% who said that would supply patient information to the police only on specific occasions, their reasons for doing so are summarised in Figure 3.10.
From Figure 3.10 we can see that the dominant reason for contacting the police was that of ensuring public safety. Other consultants supplied information only when requested to do so while others would supply information only if the individual patient could not be identified or if the patient consented.
The implications of these findings in the context of improving data sharing and collation are discussed in Section 4.2.
Figure 3.10 Reasons for passing information to the police
Town centre managers’ data
Questionnaires were sent to 135 town and city centre managers, of which 51 were completed. While this was a relatively modest return rate (38%) the data represent the majority of the large urban centres in the UK.
Perceptions of alcohol-related problems
The managers were divided in the views regarding the seriousness of alcohol-related violence and disorder in their towns and cities. Their responses when asked to rate their perceptions on a 10 point scale ranging from ‘no problem’ to ‘serious problem’ are summarised in Figure 3.11 below.
Figure 3.11 Perceptions of alcohol-related problems
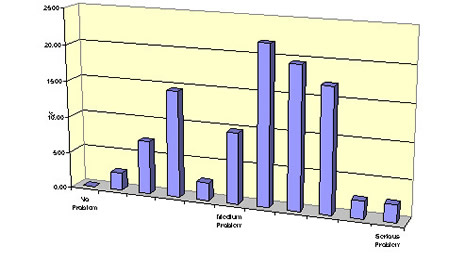
From Figure 3.11 we can see the majority of managers rated the level of problem as being between the ‘medium’ and ‘serious’ categories. The most frequent response was a score of 6 out of 10 on the ‘seriousness’ scale.
Changing levels of violence and disorder
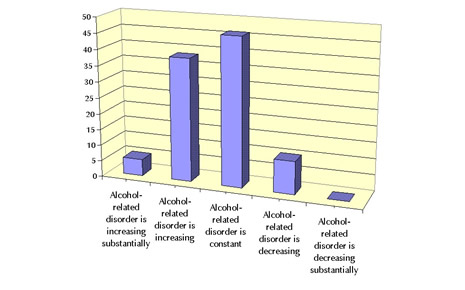
The majority of managers felt that alcohol-related violence and disorder was either increasing or was constant, as shown in Figure 3.12. In a minority of cases (10%) there had been a perceived decline in the level of problem.
Figure 3.12 Changing levels of alcohol-related problems
Data collection
Although all of the managers, with one exception, were able to provide a ‘perception’ of the seriousness of alcohol-related problems in their local areas and to indicate whether the problems had risen or declined in recent times, less than a quarter (24%) had any numerical data available to them in this context. Of those who did have some data to guide their judgements, most relied on statistics and reports provided by the police.
Measures to combat alcohol-related problems
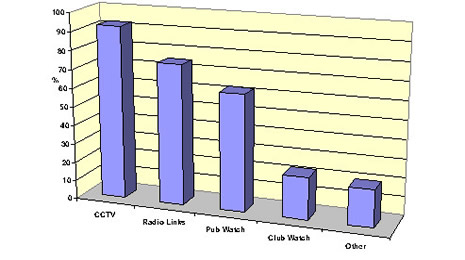
The majority of town and city centre managers (73%) felt that a relatively small amount of their work was directed towards dealing with alcohol-related violence and disorder – less than 10% of their time. Most of this was related to the development of specific measures aimed at combatting the problems. These are summarised in Figure 3.13.
The most common (92%) strategy aimed at reducing alcohol-related violence was the introduction of CCTV cameras in town and city centres. The use of radio links by security staff and police and both Pubwatch and Clubwatch schemes were also commonly reported. Among the ‘other´ measures mentioned were bye-laws, door staff registration schemes and safer trading forums.
Figure 3.13 Measures to combat alcohol-related problems
Impact of measures on levels of alcohol-related problems
While the majority of respondents felt that these measures had been effective to some degree or another, fewer than 5% of town centre managers compiled reports of alcohol-related incidents to allow objective evaluation.
Crime reduction partnerships data
A geographically representative sample of 138 CRPs was obtained.
Perceptions of alcohol-related problems
Representatives of the CRPs were asked to give their views of the seriousness of alcohol-related problems both prior to the work of the partnerships and currently. These are summarised in Figure 3.14.
Figure 3.14 Perceptions of alcohol-related problems
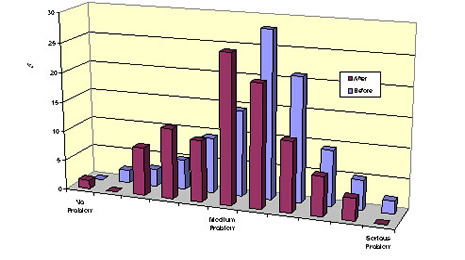
The views of the CRPs concerning levels of alcohol-related crime and disorder prior to the establishment of the partnerships were broadly consistent with those of town and city centre managers. Most felt that the levels of alcohol-related crime and violence were initially between the ‘medium´ and ‘serious´ levels. Their perceptions of current levels of seriousness, however, showed a distinct shift towards the less ‘serious´ end of the scale. Whereas 66% of respondents rated the level of seriousness as 6 or higher on a 10 point scale prior to the CRP, this had fallen to 43% for current perceptions. This difference is statistically very significant (c2 = 14.2, df = 1, p < .0001).
Such perceptions of the relative decline in the seriousness of alcohol-related problems might be seen as evidence of the effectiveness of CRPs. Equally, however, such views may be founded on false optimism or clouded judgement. We note below in Section 3.4.5 that there is often a distinct lack of rigorous evaluation of CRP activities and their impact on objective measures of alcohol-related violence and disorder. This point is further discussed in Section 4.4.
Work concerned with alcohol-related problems
CRPs varied in the extent to which their activities were focused on alcohol-related violence and disorder, as shown in Figure 3.15.
Figure 3.15 Work concerned with alcohol-related problems
From Figure 3.15 we can see that for the majority of CRPs the amount of work devoted to alcohol-related issues amounted to less than 30% of total activities. In some cases, however, the concern with alcohol-related problems was considerably higher.
Organisations involved in crime reduction partnerships
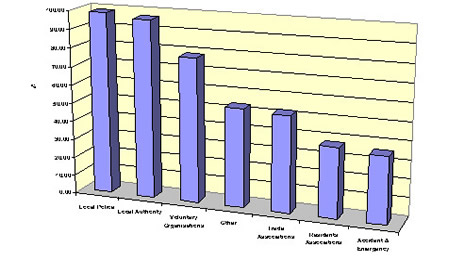
The majority of CRPs involved police, local authorities and voluntary organisations, as shown in Figure 3.16. Trade associations, residents’ associations and A&E departments were also regularly involved. Among the ‘other’ category were most frequently probation departments and health workers. Most of these groups had been in existence for about 3 years although some had been started up to 10 years ago. The majority of CRPs met on a monthly to quarterly basis.
Figure 3.16 Organisations involved in CRPs
Funding of crime reduction partnerships
The majority of CRPs relied on limited funding from the member partners - most typically the police and local authorities. In only 16% of cases were grants received from government bodies such as the Home Office, Welsh Assembly, etc. A further 17% of partnerships were currently making bids for such funding
Evaluation
When asked how the activities of the CRPs would be evaluated, many gave relatively vague replies, referring to ‘meeting targets´, ‘evaluation of performance´, ‘surveys´, etc. Only 19% of the CRPs used crime statistics as a performance benchmark and only the same proportion was subject to external audit and evaluation. Even here, however, the precise nature of the methods and measures employed in such evaluation was rarely specified.
It was also the case that nearly one quarter (23%) of all CRPs had no formal documents outlining the aims and objectives of the partnership or its achievements. This apparent lack of role definition and accountability of CRPs is discussed in Section 4.4.